Designs made by our community
Explore unique graphic designs and images crafted by creators around the world using Hiding Elephant's AI design tools. Get inspired and start creating.
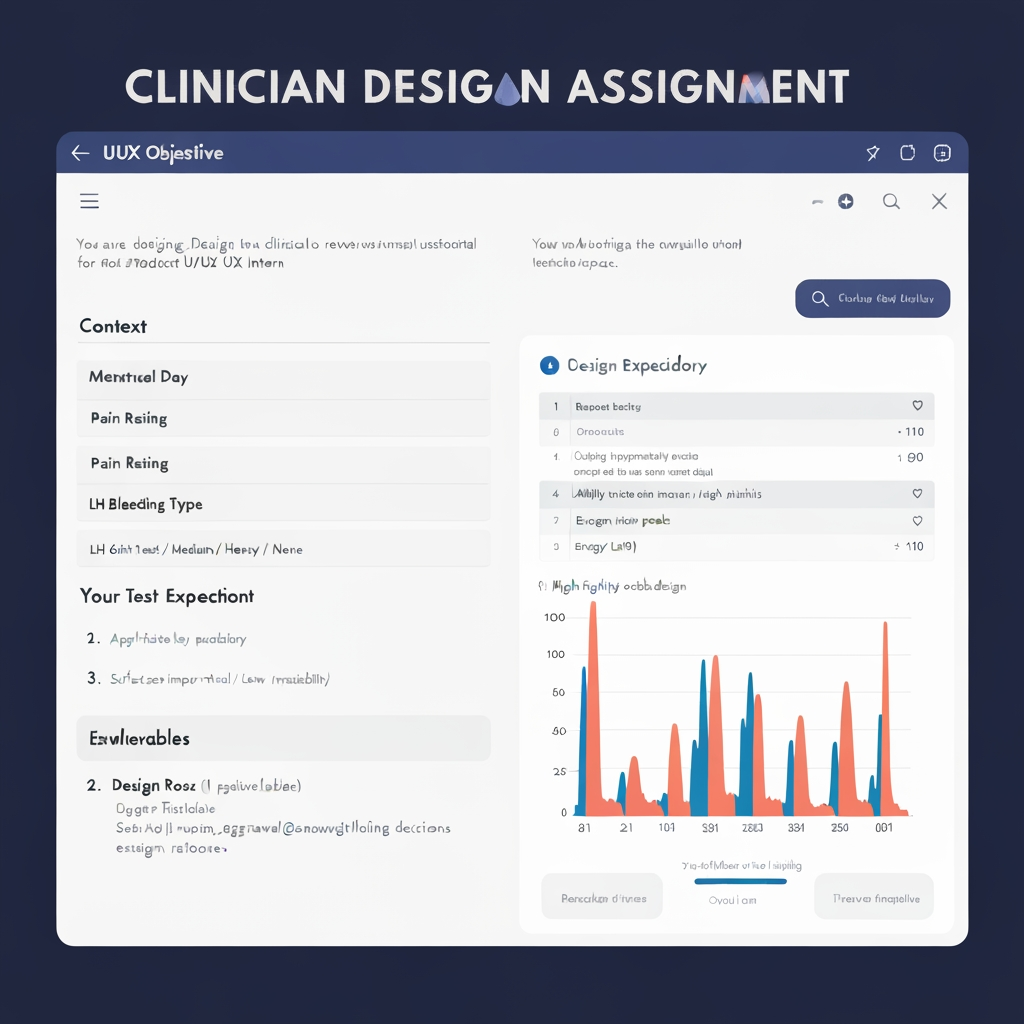
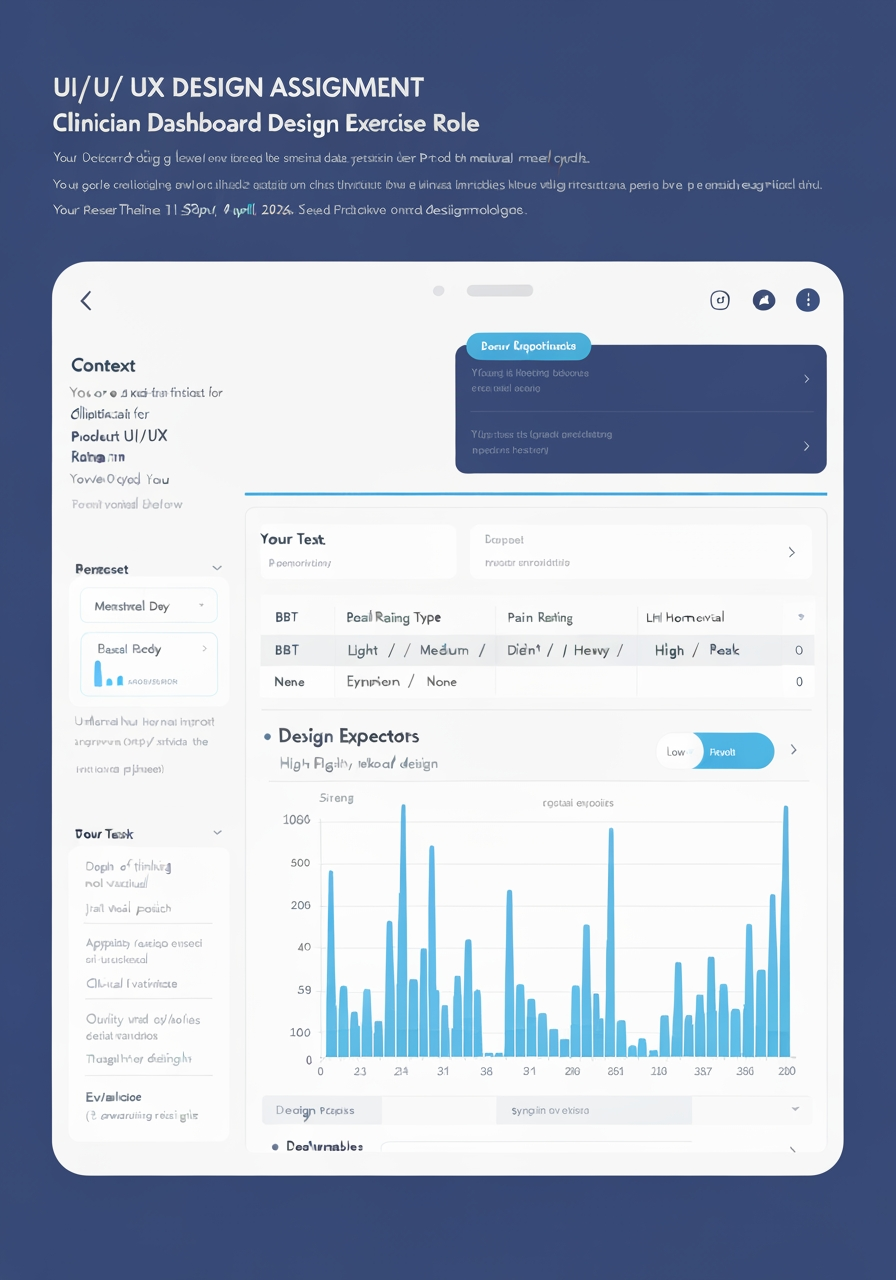
UI/UX DESIGN ASSIGNMENT Clinician Dashboard Design Exercise for Product UI/UX Intern Role Objective Design a clinician-facing dashboard that presents menstrual cycle–related data in a way that is clear, structured, and clinically meaningful. Context You are designing a digital interface for clinicians to review longitudinal patient data over a menstrual cycle. The goal is not just visualization, but enabling quick interpretation, pattern recognition, and decision support. You will be working on a novel product in the healthcare/technology space. Dataset You will be provided with a dataset (see the table below) containing: - Menstrual Day - Basal Body Temperature (BBT) - Pain Rating (0–10) - Bleeding Type (Light / Medium / Heavy / None) - LH Hormonal Test (Didn’t test/ Low / High / Peak) - Energy Level (0–10) Your Task Design a dashboard that: 1. Represents the data across the menstrual cycle 2. Highlights key patterns and relationships 3. Enables fast clinical interpretation 4. Surfaces important events (e.g., ovulation, symptom peaks) Research Requirement Before designing, you must: - Research how basal body temperature varies across the menstrual cycle - Understand how clinicians interpret ovulation, symptoms, and cycle phases Your design should reflect these insights. Design Expectations • Strong information hierarchy • Clear handling of time-series data • Appropriate use of charts and visual encodings • Ability to combine categorical and continuous data • Low cognitive load and high readability Deliverables 1. High-fidelity dashboard design 2. Design rationale (1–2 pages/slides explaining decisions and insights) Evaluation Criteria • Depth of thinking (not just visual polish) • Clinical relevance of insights surfaced • Clarity and usability of interface • Quality of visual design • Thoughtfulness of design rationale Submission Timeline 11:59PM, 4th April, 2026. Send your Deliverables at [email protected] with subject title “Assignment for UI/UX internship.” Note This is an open-ended problem. We are evaluating how you think, structure information, and design for real-world use—not just aesthetics. Data Day BBT_C Pain Bleeding LH_Test Energy 1 36.4 9 Heavy Didn’t test 2 2 36.4 9 Heavy Didn’t test 2 3 36.3 8 Medium Didn’t test 3 4 36.3 7 Medium Didn’t test 3 5 36.4 7 Light Didn’t test 4 6 36.3 6 None Didn’t test 5 7 36.3 6 None Didn’t test 6 8 36.2 5 None Didn’t test 6 9 36.3 5 None Low 7 10 36.3 5 None Low 7 11 36.4 6 None High 8 12 36.4 6 None High 8 13 36.2 7 None Peak 7 14 36.3 7 None Peak 7 15 36.5 6 None High 7 16 36.7 5 None Low 6 17 36.8 5 None Didn’t test 6 18 36.8 5 None Didn’t test 6 19 36.9 6 None Didn’t test 5 20 36.9 6 None Didn’t test 5 21 37.0 6 None Didn’t test 5 22 36.9 7 None Didn’t test 4 23 36.9 7 None Didn’t test 4 24 36.8 7 None Didn’t test 3 25 36.8 8 None Didn’t test 3 26 36.7 8 None Didn’t test 3 27 36.6 8 None Didn’t test 2 28 36.5 9 None Didn’t test 2
by @Elephant_9129727
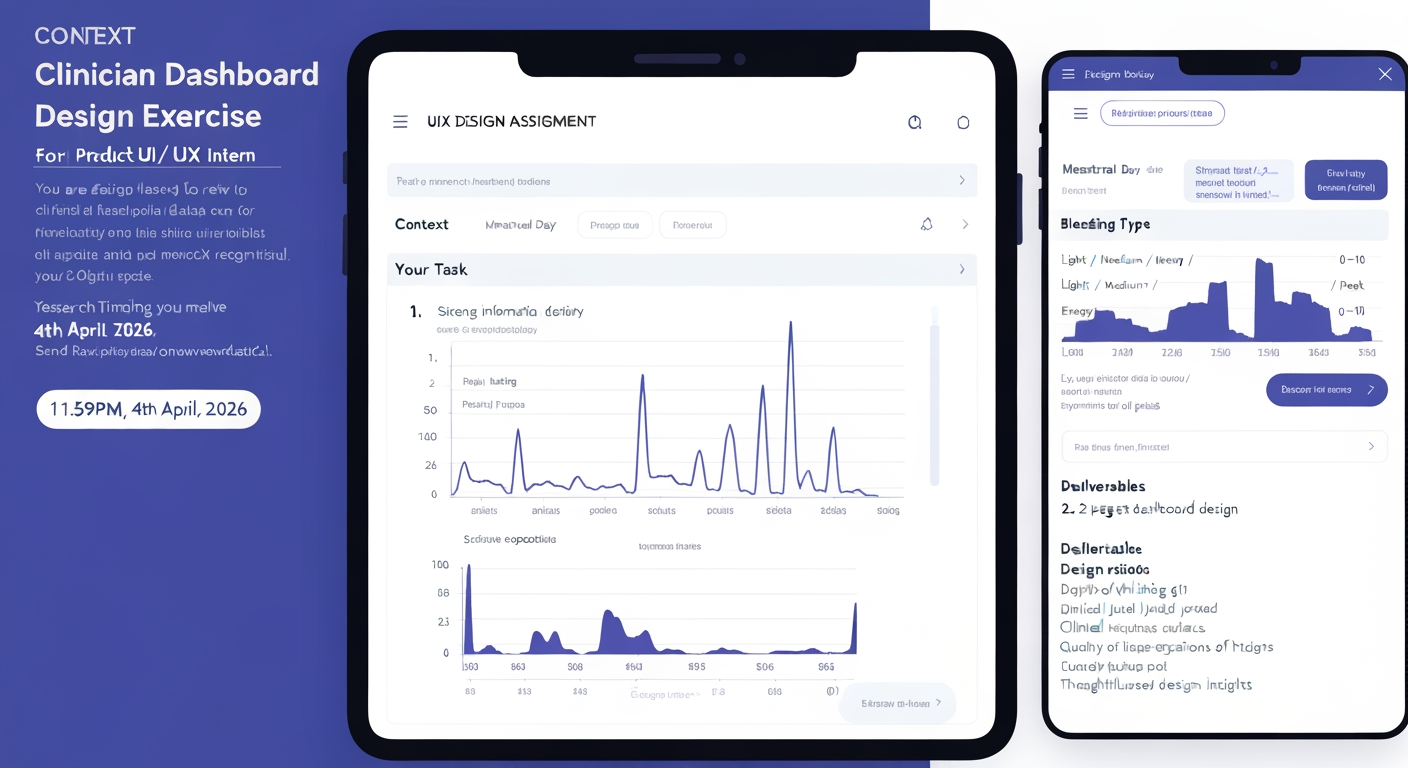
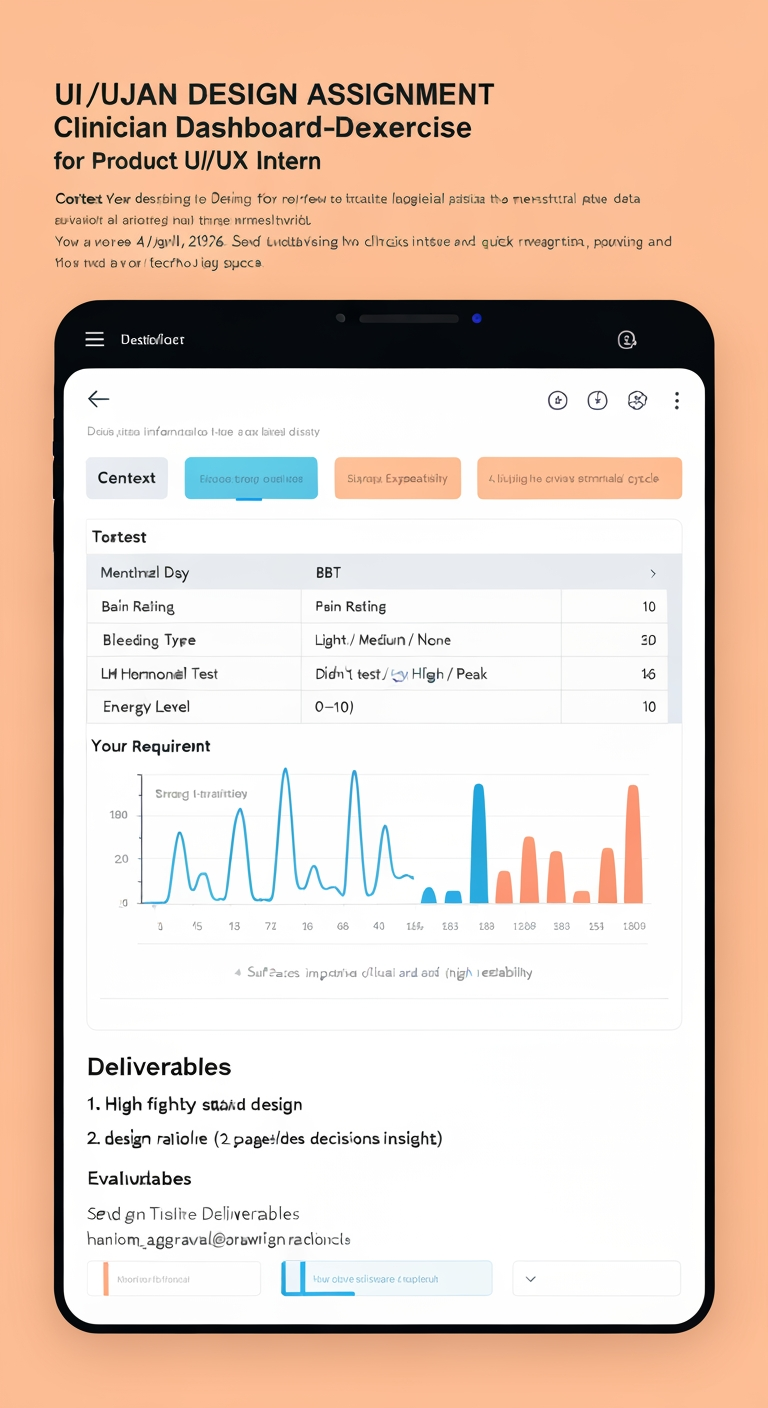
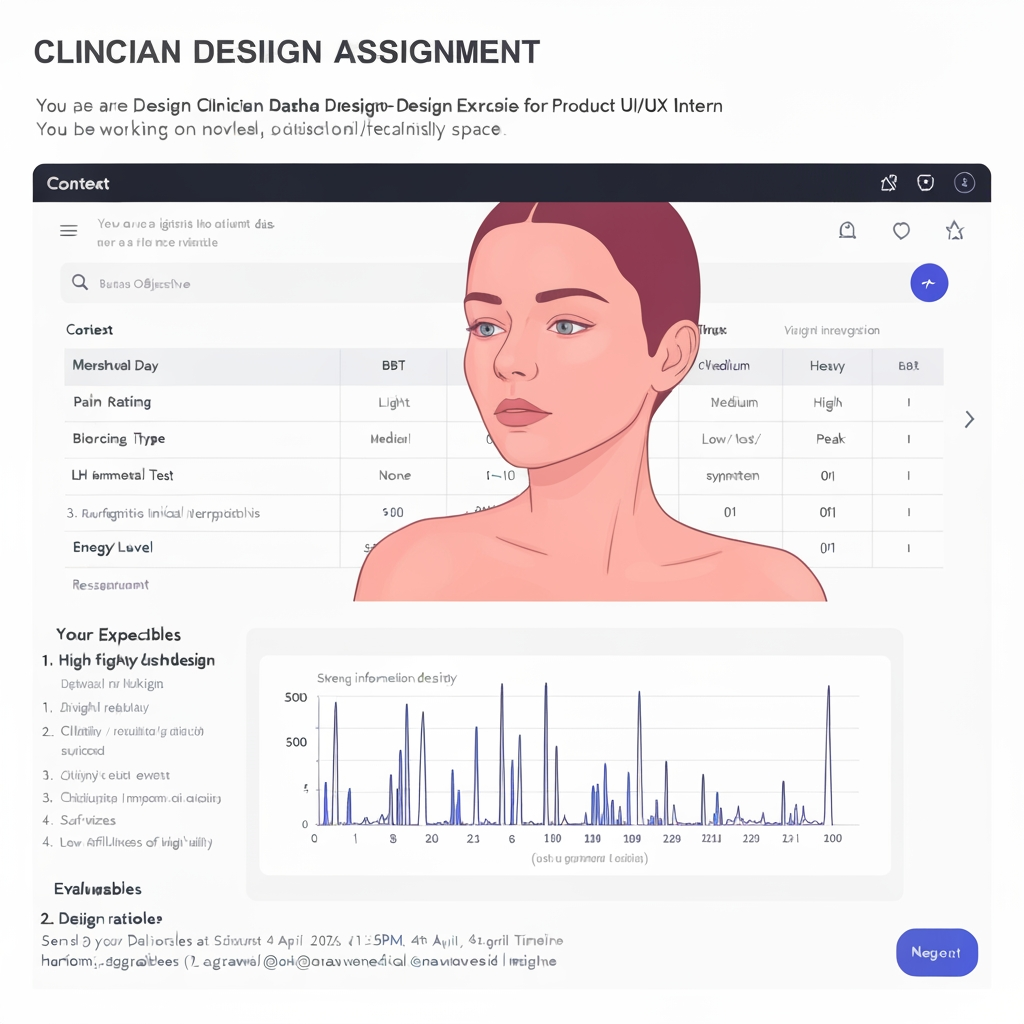


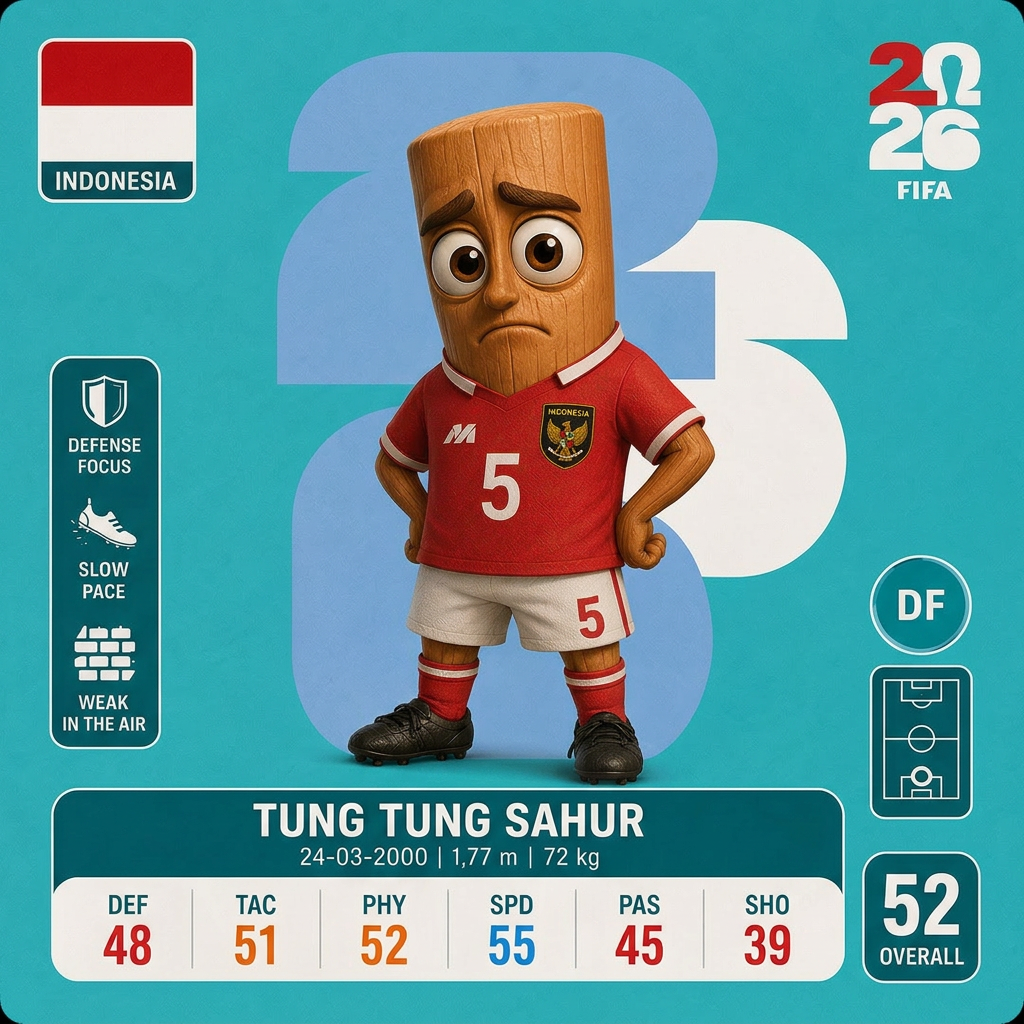


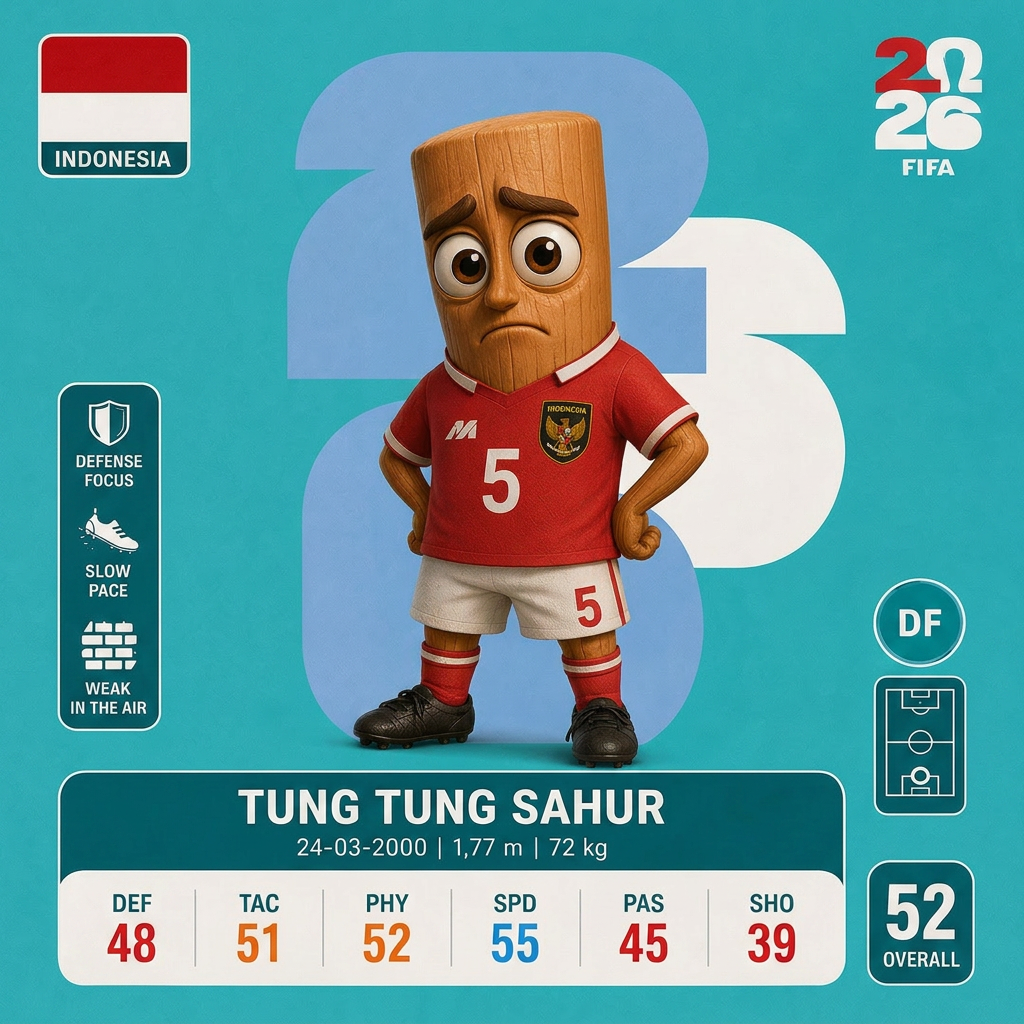

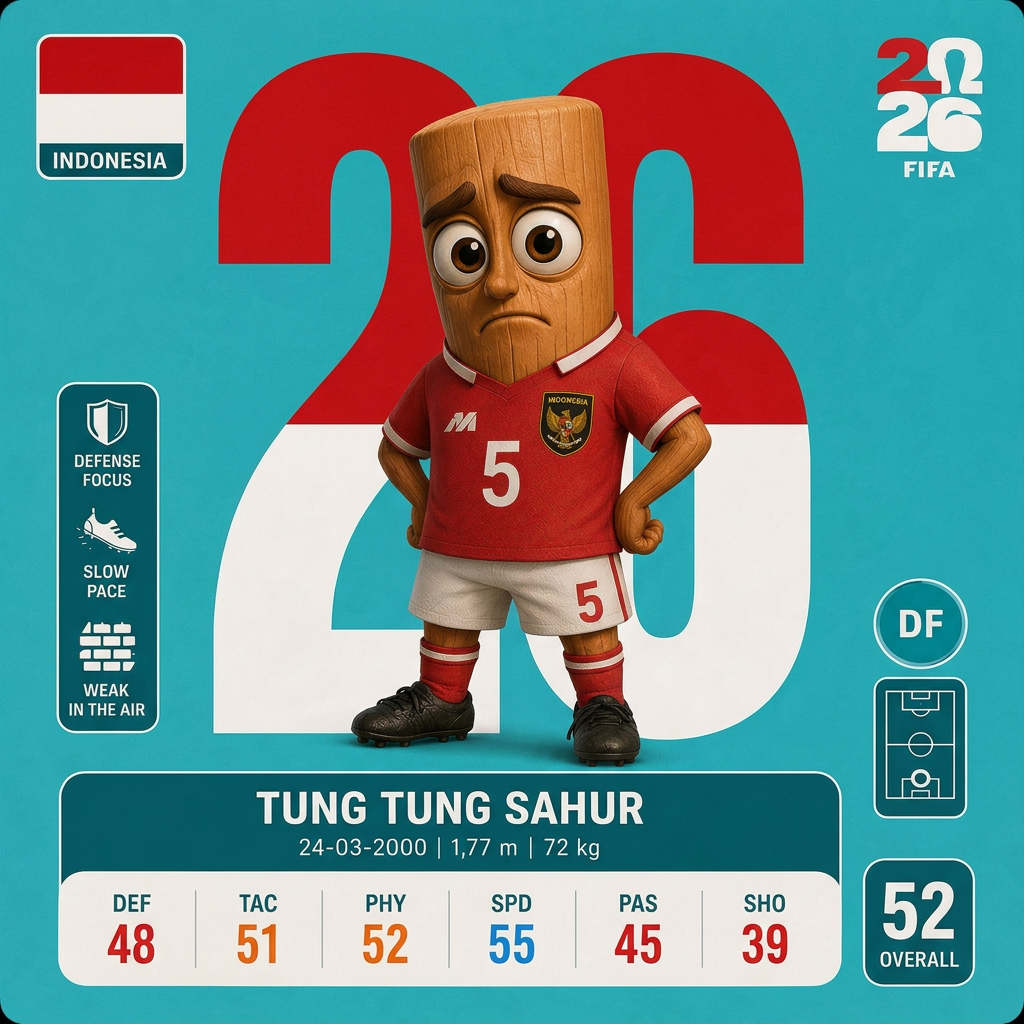
A charming, whimsical character design rendered in a high-quality 3D style with soft, rounded features and vibrant pastel colors. The subject is isolated against a solid white background, featuring clean edges and soft studio lighting to highlight its adorable expression and smooth texture.
by @Elephant_9129727


What's next?Explore more features


Go from browse to build